
Where could gold prices be in 2026?
Where could gold prices be in 2026?

Gold’s trajectory heading into 2026 appears increasingly bullish. A confluence of structural forces, relentless central-bank accumulation, global de-dollarisation, and investor demand for safe havens amid fiscal and geopolitical uncertainty may plausibly propel gold toward the $5,000/oz mark or possibly beyond within the next year.
With real yields trending lower, the U.S. dollar weakening, and supply growth stagnating despite record prices, gold’s risk-reward setup looks compelling for investors seeking both appreciation and protection.
Let’s have a deeper dive to understand what is happening.
Macro Tailwinds: Real Yields, Dollar & Policy Cycles
Gold’s price has always moved inversely to real interest rates and the U.S. dollar (DXY), and both indicators now align in gold’s favour. Real 10-year Treasury yields have fallen from their 2024 peak near +2.2% to around +1.6%, while the dollar index is down roughly 6% from spring 2024 highs. “A weaker U.S. dollar and declining real rates have historically served as a tailwind for gold,” notes BlackRock’s strategist Russ Koesterich.
Meanwhile, U.S. fiscal deficits above 6–7% of GDP and slowing global growth increase the likelihood of Federal Reserve rate cuts in 2025, which would further pressure real yields and the dollar. Historically, each easing cycle in 2001, 2008, and 2020 unleashed strong gold rallies as liquidity expanded and investors sought refuge.
Adding to the mix is a geopolitical premium. The ongoing wars, sanctions and fiscal instability have boosted gold’s status as the world’s second-largest reserve asset, surpassing even the euro, according to Reuters (Sept 2025).
Goldman Sachs projects an average of $4,000/oz by mid-2026, while HSBC now sees $5,000/oz as plausible in its bullish scenario, citing geopolitical risks and rising public debt.
Central Banks: The Silent Engine of Demand
No force has been more influential in pushing gold upwards in recent years than central-bank gold buying. Every year since 2010, central banks have been net purchasers, but since 2022, they’ve entered what the World Gold Council calls “overdrive,” buying over 1,000 tonnes annually, the most in modern history.
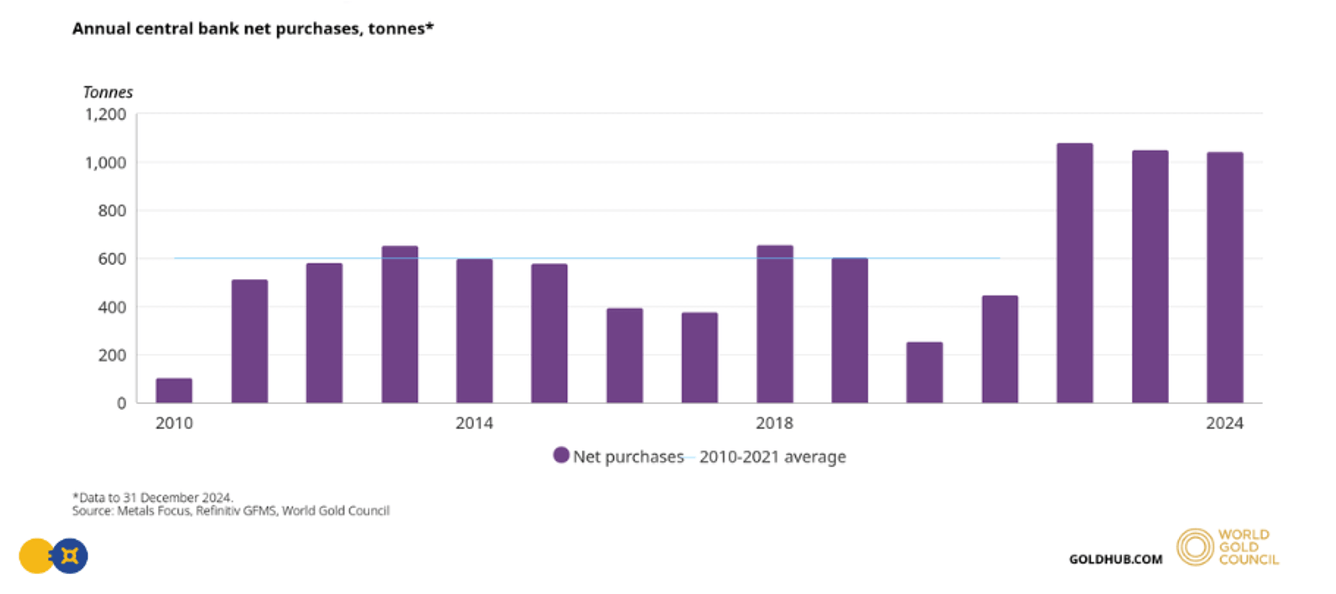
In 2024 alone, official purchases totalled more than 1,045 tonnes, led by Poland, China, Turkey, and India. Poland’s central bank governor explicitly cited a goal to hold 20% of reserves in gold, while China’s People’s Bank reported 18 consecutive months of additions. Emerging market institutions now account for over 20% of annual gold demand, up from just 10% a decade ago.
This shift is structural. After the freezing of Russia’s foreign reserves in 2022, emerging nations began diversifying away from the dollar. The prevailing mindset is that if your reserves can be frozen with a keystroke, they’re not really yours. Gold, being unencumbered by counterparty risk, has become the asset of choice for sovereign diversification.
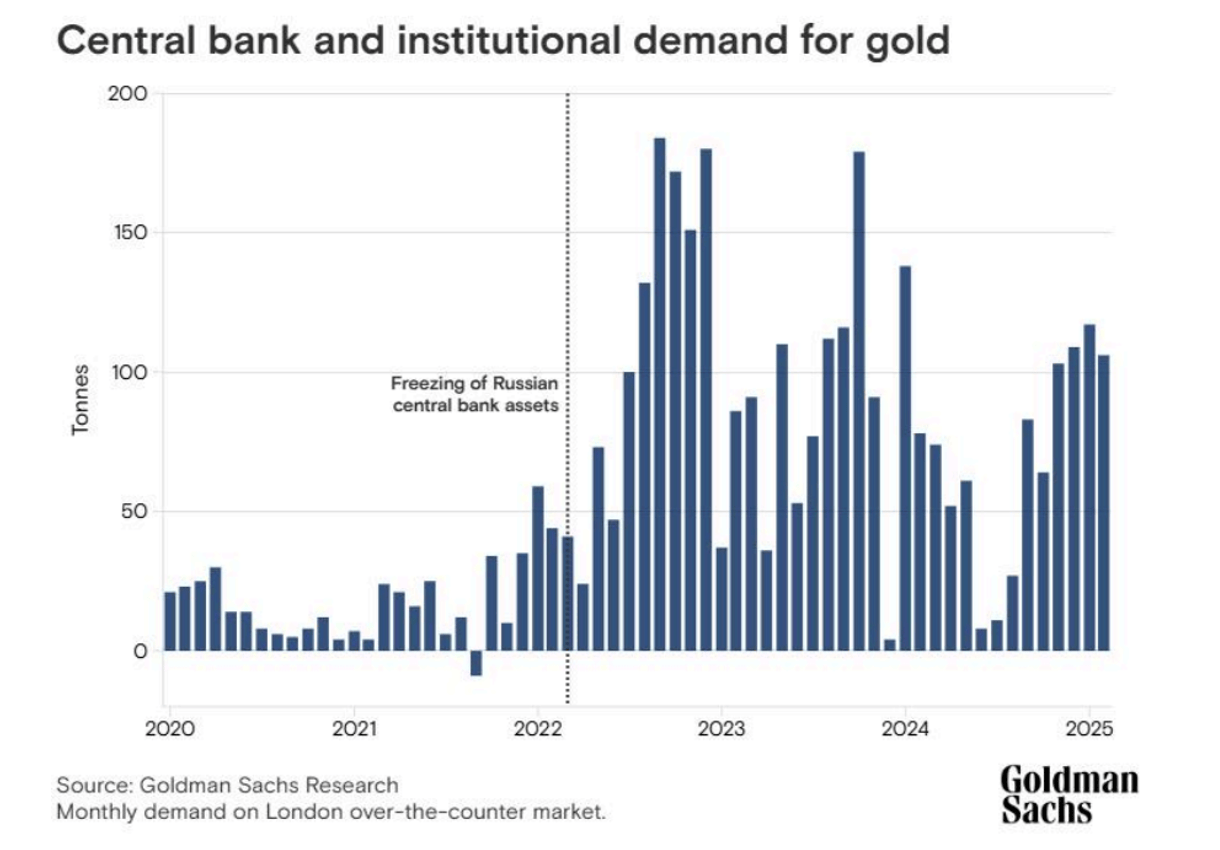
Goldman Sachs estimates that emerging market central banks have increased the pace of gold purchases fivefold since 2022 and expect the trend to continue for several years. Even more remarkably, central banks appear price-insensitive, continuing to buy despite record highs, effectively placing a structural floor under the market.
JP Morgan warns that the only major risk to gold’s rally would be a sudden drop in official sector buying, yet there’s no sign of that happening.
Private Demand and ETFs: The Retail-Plus-Institutional Bid
Beyond sovereigns, private investment demand has surged. In 2024, global investment in gold (bars, coins, and ETFs) rose 25% year-over-year to a four-year high of 1,180 tonnes. Bar and coin purchases, particularly in China and the Middle East, remained strong at ~1,186 tonnes.
Jewellery demand softened by 11% by weight due to higher prices, but total value spent still rose to $144 billion, showing resilience in price-sensitive markets like India. Consumers simply bought lighter pieces rather than abandoning gold altogether.
More significantly for institutional investors, ETF outflows reversed after three years of steady declines. By late 2024, gold-backed ETFs recorded modest net inflows (+18.6 tonnes in Q4). The World Gold Council called it “the first year since 2020 that ETFs didn’t drag on demand.”
Supply: Flatlining Mine Output, Rising Costs
While demand expands, gold’s supply side remains stubbornly constrained. Global mine production in 2024 totalled approximately 3,661 tonnes, up just 0.5% from the previous year, barely above 2018 levels.

The cost of producing gold is at historic highs. The All-In Sustaining Cost (AISC) averaged $1,358/oz in Q1 2023, according to the World Gold Council, up 10% year-on-year due to inflation in labour, fuel, and materials. Majors like Newmont and Barrick now operate near $1,200/oz breakeven.
Environmental, social, and permitting hurdles mean few large projects are in the pipeline. The average reserve grade at mines continues to decline, meaning more ore must be processed for the same output, raising costs further. Even with prices near $4,300/oz, miners remain cautious about overexpanding, scarred by the overinvestment and write-downs of the 2010s.
Recycling provides limited relief, with recycled supply up 11% in 2024 to 1,370 tonnes, but still largely inelastic. Total supply (mining + recycling) reached 4,974 tonnes, barely covering demand. Crucially, nearly 30% of mined output was absorbed by central banks alone, tightening available liquidity.
With mine development lagging and marginal projects slow to activate, the “peak gold” narrative gains traction.
Scenarios for 2026
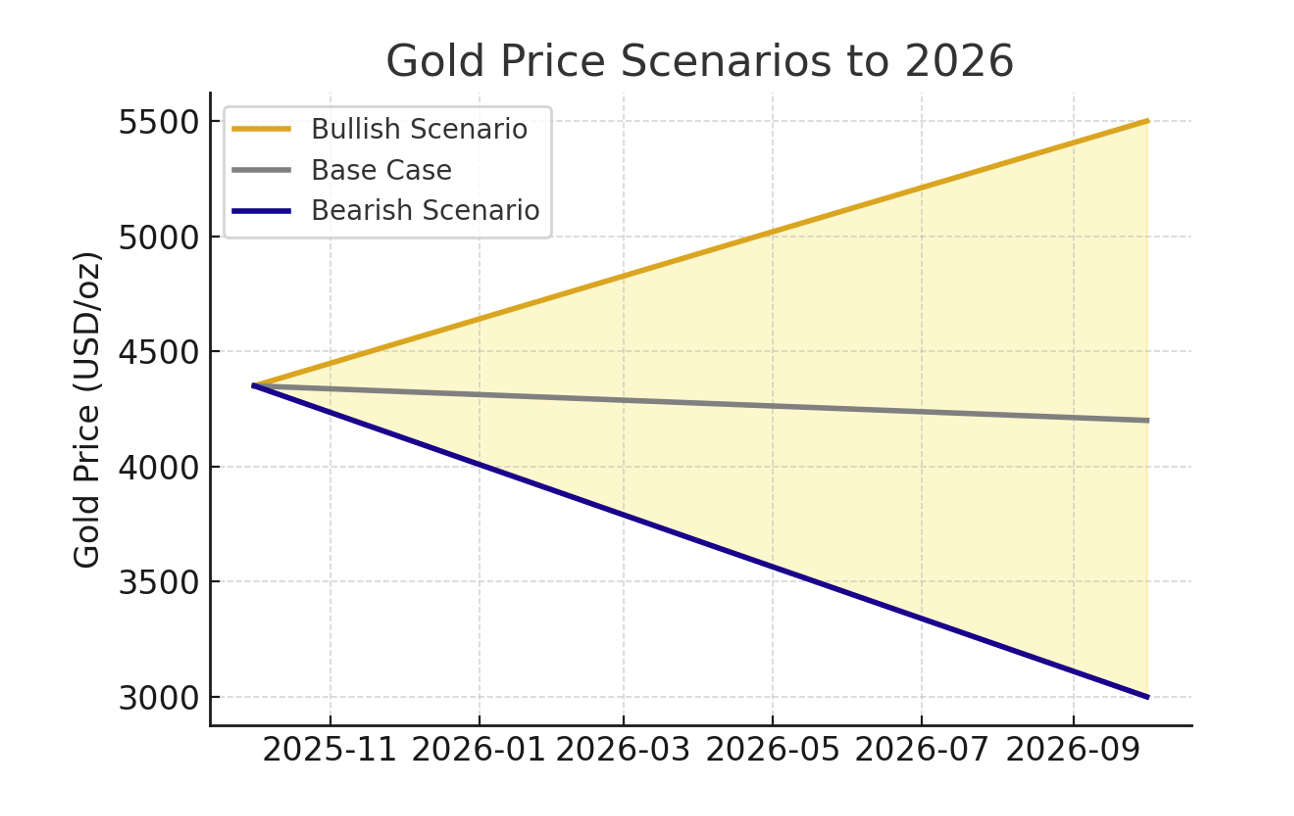
Base Case (≈50% probability):
A soft landing occurs. The Fed begins moderate rate cuts while inflation remains subdued. Real yields hover near zero, and the dollar drifts weaker. Central banks maintain purchases, and ETF inflows stabilise. Gold trades in a $3,500–$4,500 range through 2026, supported by “sticky hands” like sovereign buyers and long-term investors.
Bull Case (≈30% probability):
A global downturn or geopolitical shock sparks aggressive easing and renewed QE. Real yields turn negative; the dollar weakens sharply. ETF inflows surge, and speculative longs pile in. In this setup, gold could overshoot to $5,000–$5,500/oz by mid-2026 in what Goldman Sachs calls a “right-tail scenario.” HSBC and ANZ share similar forecasts of $4,600–$5,000 under this environment.
Bear Case (≈20% probability):
A productivity-driven U.S. boom pushes real yields higher, the Fed delays cuts, and the dollar rallies. Central banks pause purchases, and investor sentiment cools. Gold could retrace to $2,500–$3,000/oz, though few expect a collapse below $2,000 given official-sector support.
Despite the potential downside, most analysts agree the skew remains to the upside. There are more catalysts for gains than for a sustained reversal.
Portfolio Role: Insurance, Hedge, and Opportunity
Beyond speculation, gold serves as portfolio insurance. During the 2008 crisis and 2020 pandemic, gold not only preserved capital but ended both years higher, confirming its role as a hedge against financial instability.
For investors, the strategic case is clear:
- • In a 60/40 stock-bond portfolio, a 5–10% allocation to gold can materially improve risk-adjusted returns.
- • In a tail-risk portfolio, allocations up to 15% may be justified, per Bridgewater’s Ray Dalio.
- • Gold’s low correlation to both stocks and bonds (near zero long term) makes it a true diversifier, unlike defensive equities or even long Treasuries, which fail during inflationary shocks.
Bitcoin often draws comparison as “digital gold,” but its volatility and short track record make it unsuitable as a stable hedge. Gold’s five-millennia reputation as “the currency of last resort” remains unmatched.
Exposure Options: From Bullion to Equities
Investors can access gold’s upside across several instruments:
- • Physical Gold: The purest exposure. Coins or bars with no counterparty risk, though storage costs apply at higher volumes.
- • ETFs (GLD, IAU, SGOL): Liquid and cost-efficient, tracking spot gold while offering easy portfolio integration.
- • Futures & Options: For tactical traders seeking leveraged exposure or hedging strategies.
- • Mining Equities: Offer torque to gold’s price. Historically, when gold doubles, miners can triple. ETFs like GDX and GDXJ capture diversified exposure, while royalty companies (Franco-Nevada, Wheaton Precious Metals) provide high-margin participation with lower operational risk.
However, miners carry idiosyncratic risks, from jurisdictional instability to cost inflation. Governments could impose windfall taxes if gold prices surge too far. Hence, most professionals favour a core-satellite mix:
- • Core: 5–10% in physical or ETF gold for protection.
- • Satellite: 5% in miners or royalties for upside leverage.
Investor Takeaway
Gold enters 2026 with its strongest fundamentals in decades. Sovereign stockpiling, flat mine supply, negative real yields, a softening dollar, and geopolitical tension that refuses to fade. With demand from both central banks and investors outpacing constrained supply, the market’s equilibrium price is shifting upward.
Even conservative forecasts now frame $4,000–$5,000/oz as a base case, not a dream. Goldman Sachs and HSBC both expect a continued climb through 2026, and historical precedent shows gold tends to overshoot consensus when liquidity turns and confidence in fiat wavers.
In an era of expanding debt, fiscal strain, and monetary experimentation, gold is reasserting itself as the only truly neutral store of value. The next leg higher may not just protect capital, it may redefine what stability looks like in global portfolios.