
The 10 biggest copper mines in the world
The 10 biggest copper mines in the world
Ten operations supplied roughly one-fifth of the world’s mined copper in 2025, showing why disruptions at a handful of assets can reverberate across the market.
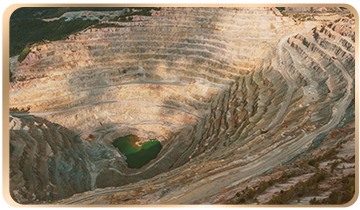
Copper sits at the centre of the modern economy. It is essential to power grids, electric vehicles, data centres and renewable-energy systems. Yet the mine supply behind that demand is far more concentrated than many investors realise.
World Metal Statistics data published by Chile’s copper commission, Cochilco, put 2025 global mine production at 23.665 million tonnes. The US Geological Survey’s preliminary estimate is lower, at 23.0 million tonnes. Using the Cochilco baseline, the ten operations in this ranking supplied 4.927 million tonnes, which means 20.8% of world output.

- THE CENTRAL FACT
More than one tonne in every five was produced by just ten operations, while Escondida alone supplied about 5.7% of the global total.
That concentration gives the largest sites strategic significance beyond their owners. Changes in grades, recoveries, water or power availability, underground conditions, logistics and community relations can alter the outlook for a market measured in tens of millions of tonnes.
The ten operations at the centre of global supply
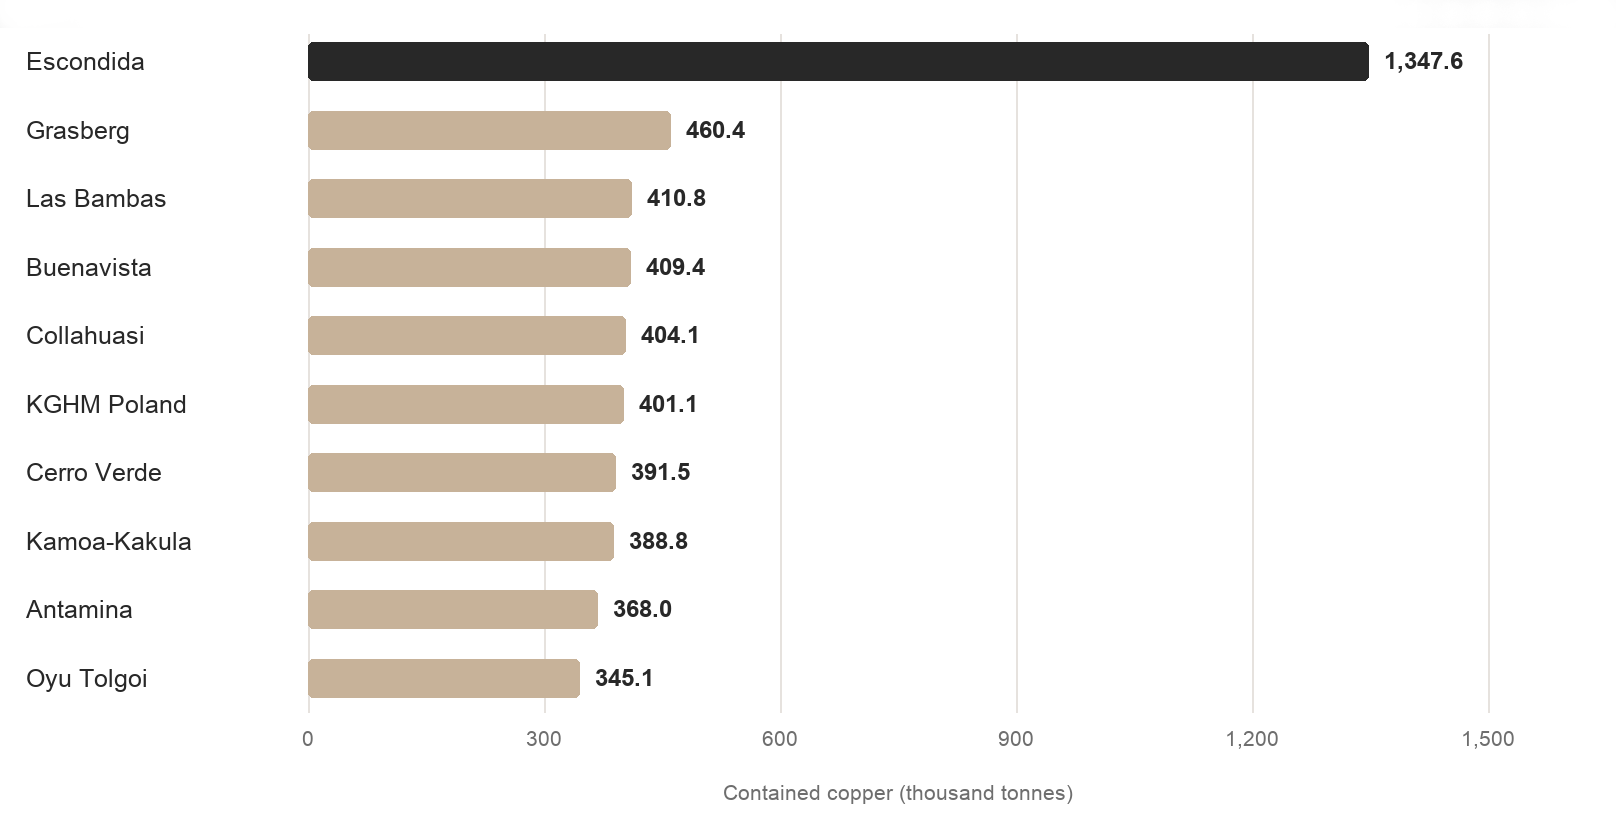
Escondida in Chile remains the clear leader. On a contained-metal basis, the operation produced 1.348 million tonnes in 2025, about 2.9 times Grasberg’s output. BHP operates Escondida with partners Rio Tinto and the Japanese consortium JECO.
| NO. | OPERATION / COMPLEX | COUNTRY | 2025 COPPER (kt) | WORLD SHARE |
|---|---|---|---|---|
| 1 | Escondida | Chile | 1,347.6 | 5.7% |
| 2 | Grasberg | Indonesia | 460.4 | 1.9% |
| 3 | Las Bambas | Peru | 410.8 | 1.7% |
| 4 | Buenavista | Mexico | 409.4 | 1.7% |
| 5 | Collahuasi | Chile | 404.1 | 1.7% |
| 6 | KGHM Polish Operations | Poland | 401.1 | 1.7% |
| 7 | Cerro Verde | Peru | 391.5 | 1.7% |
| 8 | Kamoa-Kakula | DRC | 388.8 | 1.6% |
| 9 | Antamina | Peru | 368.0 | 1.6% |
| 10 | Oyu Tolgoi | Mongolia | 345.1 | 1.5% |
| Total | 4,926.8 | 20.8% |
Values are rounded. Global shares use Cochilco’s 23.67 Mt total.
Escondida operates at a different scale
Source: MINING.COM
Escondida contributed 27% of the top ten’s combined production. Its lead is so large that it produced more copper than Grasberg, Las Bambas, and Buenavista combined. The comparison uses contained copper in concentrate plus cathode for Escondida; some operators, notably Freeport-McMoRan, disclose site-level copper primarily through sales volumes. The ranking therefore reflects the best comparable public measure available, not a single universal accounting definition.
Why disruptions at a few sites matter
The 2025 operating record illustrates the point. A mud-rush incident at Grasberg in September forced the suspension of major underground operations. Freeport reported roughly 1.0 billion pounds of copper output at the complex for the year, versus about 1.7 billion pounds at normal operating rates.
At Kamoa-Kakula, seismic activity and subsequent flooding on the eastern side of the Kakula mine curtailed production from May. Full-year output still reached 388,838 tonnes, but that was below the 437,147 tonnes produced in 2024 and well below the annualised rate demonstrated before the disruption.
These were local operating events. Their significance to the wider market came from the exceptional scale of the assets involved. When a handful of mines carry such a large share of supply, operational reliability becomes a global variable.

Peru has three mines of the world’s top ten
Las Bambas, Cerro Verde and Antamina produced a combined 1.170 million tonnes of copper in 2025. Peru’s Ministry of Energy and Mines reported national output of 2.770 million tonnes, meaning those three operations accounted for about 42.3% of the country’s production.
That combination of geology, scale and decades of mine development has made Peru one of the world’s most important copper-producing nations.
Investor takeaway
Copper demand is global, but mine supply is not evenly distributed. The ten operations in this ranking produced roughly one-fifth of global output in 2025, and a single mine, Escondida, accounted for close to 6%.
- As electrification, grid investment and digital infrastructure increase the economy’s dependence on copper, investors need to look beyond headline demand forecasts. The resilience of supply, where it is produced, how it is measured, and how reliably the largest sites can operate, matters just as much.