
Is there an oil boom in 2025?
Is there an oil boom in 2025?
Oil prices in 2025 have been subdued compared with the volatility of the last five years; however, the oil industry is enjoying a quieter boom built on disciplined supply management, resilient demand and generous shareholder distributions.
Brent crude averaged almost $80/bbl in 2024 and slipped towards $67/bbl in the second quarter of 2025 as OPEC+ unwound production cuts and non‑OPEC supply expanded. Demand continued to tick upward, exceeding 104 mb/d driven entirely by non‑OECD economies even as OECD consumption plateaued.
Companies across the sector used mid‑cycle prices to generate strong free cash flow and return capital to shareholders through dividends and buybacks. This article examines price trends, supply and demand dynamics, inventories, corporate performance and the risks investors should watch when evaluating oil as an investment opportunity in 2025.
Price Trends: Calm Markets and Structural Backwardation

Brent crude prices have moved in a remarkable arc since the pandemic: from a collapse in 2020 to a brief run at triple‑digit highs in 2022 and a return to mid‑cycle levels in 2024–25. Data from the St. Louis Fed’s shows that Brent averaged almost $80/bbl in 2024, down from $82.3/bbl in 2023 and $99.0/bbl in 2022.
Quarterly data for 2025 shows the downward drift to $75.0/bbl in the first quarter, slipping to $67.0/bbl by the second quarter. This path reflects a market still digesting the 2022 price shock, with rising non‑OPEC supply and concerns over macroeconomic weakness offsetting geopolitical premium.
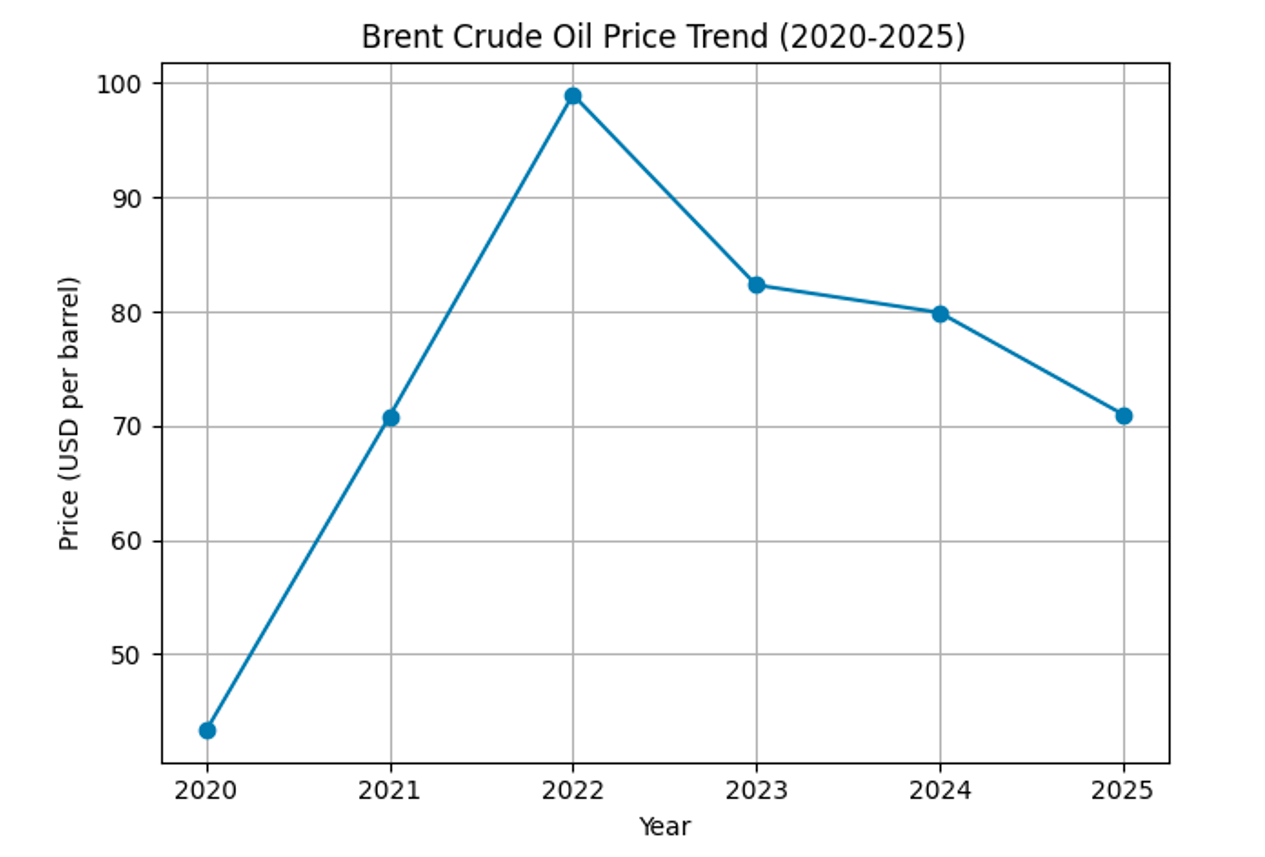
Figure 1 shows the annual Brent price trend with these quarterly movements. Prices recovered strongly in 2021 as vaccines rolled out and global mobility resumed, spiked in 2022 following Russia’s invasion of Ukraine, and then cooled as OPEC+ supply discipline relaxed and demand growth moderated. Notably, 2025 has been characterised by unusually low volatility; the forward curve shows a pronounced backwardation in the short-term prompt barrels trade at a premium to future deliveries but flattens and even tips into contango by late 2026, signalling expectations of looser balances ahead.
Supply Outlook: Abundant but Managed
OPEC+ policy and spare capacity
OPEC and its partners entered 2025 still holding 2.2 mb/d of voluntary production cuts, of which Saudi Arabia contributed 1 mb/d. As prices softened, the group moved to unwind these cuts faster than expected. By mid‑2025, most of the withheld barrels were restored, pushing the coalition’s output to around 105.5 mb/d and lifting global supply growth to an expected 2.5 mb/d for the year.
Despite this increase, OPEC+ retained significant spare capacity of about 5.3 mb/d, or roughly 5% of world demand concentrated mainly in Saudi Arabia (3.1 mb/d), the United Arab Emirates (1.1 mb/d) and smaller amounts in Iraq and Kuwait. This buffer gives OPEC the ability to pull down price spikes. This spare capacity maintenance is contributing to the current low volatility environment.
Non‑OPEC growth engines
Outside OPEC, supply momentum is good. The International Energy Agency (IEA) expects non‑OPEC output to add roughly 1.3 mb/d in 2025. The United States remains the largest contributor, with crude production hovering near 13.3 mb/d even though the total U.S. rig count has drifted down to 539 rigs as companies drill fewer wells but focus on the most productive plays. Importantly, rig activity has declined steadily, down 25% in 2024 and 2023 cumulatively, highlighting a shift toward capital discipline rather than volume growth.
Meanwhile, new projects in Guyana are transforming the supply landscape. Exxon and partners started a fourth floating production vessel in August 2025, lifting capacity to more than 900,000 b/d and moving toward a 1.7 mb/d target by 2030. Brazil’s pre‑salt fields and Canadian oil sands expansions add to the steady flow of non‑OPEC barrels.
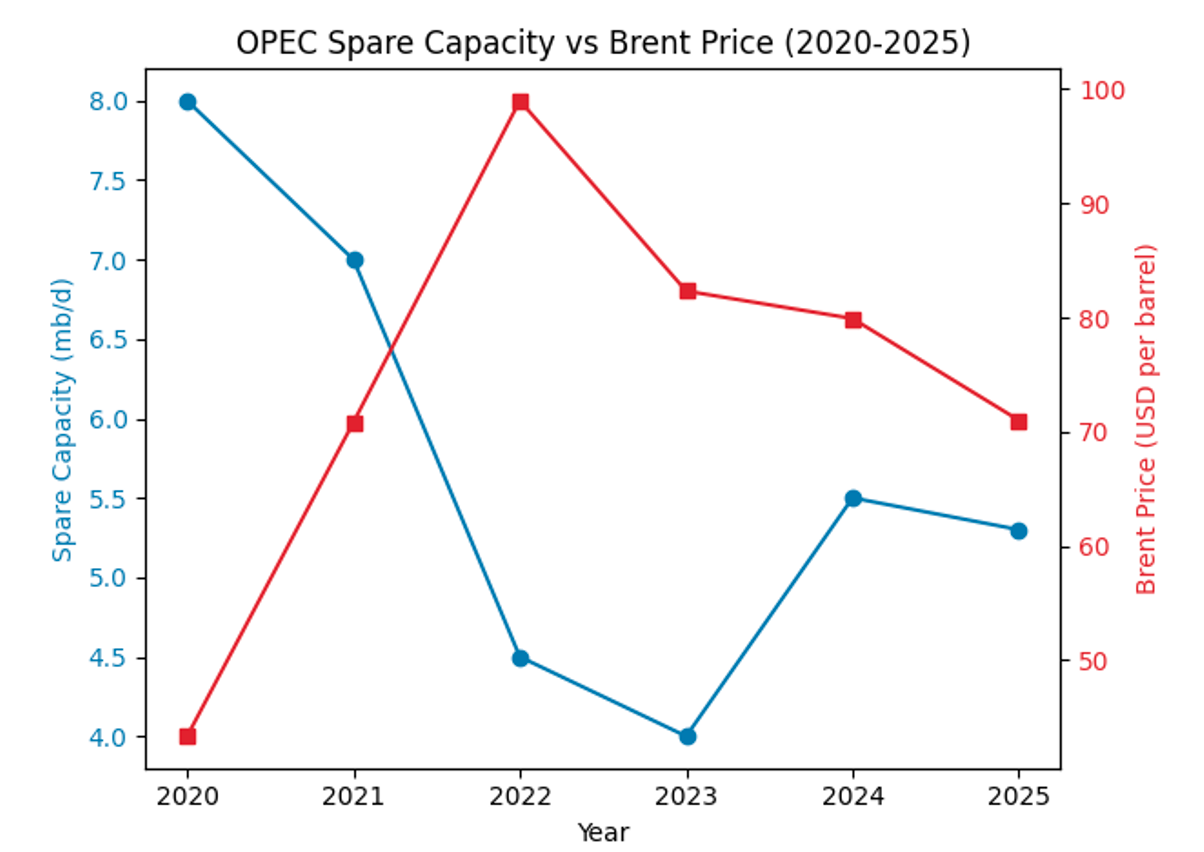
Figure 2 compares OPEC spare capacity with the Brent price trend. Spare capacity fell sharply after the pandemic as demand rebounded and OPEC+ cuts limited available cushion; it bottomed in 2022 at around 4 mb/d but expanded again in 2024–25 as new Gulf projects came online. The inverse relationship between spare capacity and price highlights OPEC’s influence: when spare capacity is plentiful, prices tend to be lower, and vice versa.
Demand Outlook: Resilient, Non‑OECD Driven
Global oil demand in 2025 is expected to reach about 104 mb/d, a modest increase of 0.7 mb/d from 2024. The composition of this growth is interesting. Almost all the incremental demand comes from non‑OECD economies, while OECD consumption remains flat. The IEA forecasts that OECD demand will be unchanged year‑on‑year, with declines in the United States, Europe and Japan offset by pockets of strength in petrochemicals and aviation. By contrast, China, India, the Middle East and Latin America collectively add around 0.6 mb/d of demand, reflecting rising mobility, industrial activity and petrochemical expansion.
Jet fuel consumption is recovering the fastest; IEA data show that kerosene demand in 2025 is up roughly 2% year‑on‑year, though still just below 2019 levels. Road fuels tell a tale of two worlds: gasoline and diesel use in the OECD is plateauing due to efficiency gains and growing electric‑vehicle adoption, whereas emerging economies continue to see rising vehicle fleets. Petrochemical feedstock demand is also robust, driven by new crackers in Asia and the Middle East. Overall, these patterns yield a still‑growing but structurally slower demand profile that supports oil’s “stickiness” in the energy mix even as its share gradually declines.
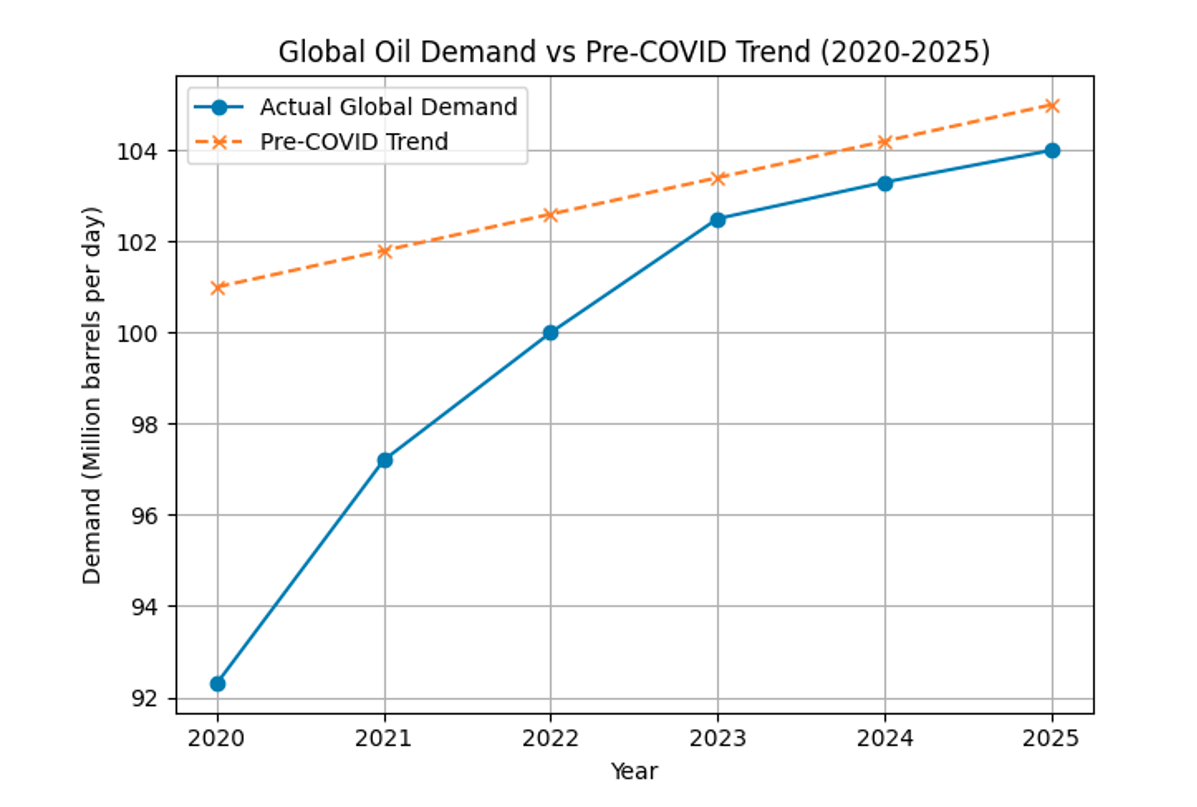
Figure 3 juxtaposes actual global demand growth with a simple projection of the pre‑COVID trend. The divergence highlights the pandemic‑induced demand destruction and the subsequent recovery; although demand surpassed its 2019 level by 2022, it remains about a million barrels per day below the path the world would have been on absent the pandemic.
Inventories and Market Balance
Inventories provide a pulse check on market tightness. OPEC’s April report indicated that commercial crude inventories in the OECD totalled 2.746 billion barrels at the end of February 2025, only 71 million barrels below the five‑year average and 16 million barrels below the previous month.
In other words, stocks are low but not alarmingly low. This nuance matters because low inventories raise spot prices and reduce forward contract prices, but the modest deficit relative to historical norms suggests the market is not dangerously undersupplied at the moment.
Outside the OECD, inventories have been rising. Chinese refiners and national oil companies have quietly added crude to both strategic and commercial tanks, and oil “on water” has increased, contributing to a build in global observed stocks. The IEA therefore expects an implied surplus approaching 3 mb/d in 2026 if OPEC+ continues to increase output and demand growth remains muted.
Corporate Performance and Investor Implications
While price action has been unremarkable, corporate performance has been outstanding. Energy companies emerged from the pandemic with lean cost structures and renewed focus on capital discipline.
By mid‑2025, ‘supermajors’ such as ExxonMobil, Chevron and Shell were generating free‑cash‑flow (FCF) yields between 5% and 10%, enabling generous dividends and share repurchases even at $70 oil.
Sector dividend yields illustrate the point. These yields are well above the S&P 500 average and underpin the sector’s income appeal.
| Sub-sector | Dividend Yield (%) |
|---|---|
| Integrated Oil/Gas | 3.69 |
| Production & Exploration | 2.93 |
| Distribution | 2.97 |
| Oilfield Services | 2.74 |
Table 1 summarises dividend yields by sub‑sector. The high yields, coupled with low leverage, provide a margin of safety. Companies are using their windfall profits to repay debt, maintain conservative capital spending (well below the mid‑2010s peak) and pursue bolt‑on mergers rather than aggressive expansion.
This behaviour reduces the risk of value‑destructive overinvestment that characterised previous booms and makes current cash returns more sustainable.
For investors, the combination of high yield, capital discipline and undemanding valuations (energy equities trade at 8–12× earnings versus ~20× for the S&P 500) argues that a “value boom” is underway even without a price boom.
Scenario Analysis and Risks
Bull Case
A bullish scenario would see Brent prices returning to $80–90/bbl in late 2025 or 2026. This would require a combination of stronger‑than‑expected demand (for example, a Chinese stimulus boom or re‑acceleration in aviation), unexpected supply disruptions (geopolitical flare‑ups, severe hurricane season or unplanned outages) and renewed OPEC+ restraint if inventories build too quickly. In this scenario, backwardation(rising spot prices and falling forward prices) would steepen, money managers would build length in crude futures and energy equities, particularly upstream producers and oilfield services would outperform.
Base Case
The base case envisions Brent remaining in a $65–75/bbl range through 2026. OPEC+ keeps output high but ready to adjust; non‑OPEC growth slows modestly; demand growth continues at about 0.7 mb/d per year, reflecting the energy transition’s gradual drag. Inventories rise somewhat, but not enough to trigger a glut. In such a “mid‑cycle” environment, energy equities can deliver high single‑digit total returns via dividends and moderate share price appreciation. Investors should emphasise integrated majors and midstream for defensiveness, while selectively owning low‑cost producers for optionality.
Bear Case
A bearish case would see supply overshoot or demand falter, driving Brent into the $50s/bbl. Key catalysts could include an economic recession that cuts oil demand by 1–2 mb/d, continued output growth that materially exceeds forecasts, or a breakdown in OPEC+ cohesion, prompting a market‑share war. Inventories would build rapidly and upstream equities would underperform, though the impact on dividends might be cushioned given companies’ low break‑even levels. In this outcome, investors should lean on midstream and integrated majors and be prepared for volatility.
Macroeconomic Risk
Particularly, a U.S. or Chinese recession would weigh on transport and industrial fuel demand. Policy and ESG pressures could accelerate EV adoption or impose stricter emission limits, eroding long‑term oil demand and compressing equity multiples. Geopolitical shocks (e.g., sanctions relief for Iran/Venezuela or escalated conflict in oil‑producing regions) can add or remove barrels unexpectedly. Finally, cost inflation in rigs, labour, and materials could squeeze margins even if prices remain steady.
Conclusion: A Stealth Boom Built on Cash Flows
The answer to “Is there an oil boom in 2025?” depends on what we mean by “boom.” There is no explosive price spike. Brent is trading comfortably in the $60s and low $70s. However, there is a boom in profitability, free cash flow and shareholder returns. OPEC+ supply discipline, non‑OPEC growth, resilient emerging‑market demand and manageable inventories are combining to create a balanced market where companies can prosper without chasing volumes. The sector’s average dividend yield exceeds 3%, and giants like Saudi Aramco and ExxonMobil continue to generate billions in free cash even at $70 oil.
For investors, this environment offers an attractive combination of income, optionality and inflation protection. Maintaining exposure to diversified energy equities, selectively owning low‑cost producers and allocating to midstream infrastructure can provide both yield and capital appreciation potential. While risks remain, the current setup suggests a stealth boom is underway: one measured not by headline prices but by the quiet compounding of cash returns to shareholders.